
The Hidden Realities of Job Searching in 2024
Workers Experiencing Stark Financial and Emotional Tolls
Introduction
Workers across the United States are in a hidden struggle right now - seeking jobs that meet their basic needs with little success. Headlines in 2024 rollercoaster from worry about the impact of generative AI on jobs and the high degrees of burnout to positive highlights of low unemployment rates and wage gains post-pandemic. Larger economic data for most of this year points to strong labor participation and low unemployment, with signs over July and August of a softening of the job market.
Yet there is a story going untold: the majority of workers do not feel like the job market is good - and it’s taking a toll emotionally and economically. Nearly four out of five workers want jobs and can’t find them.
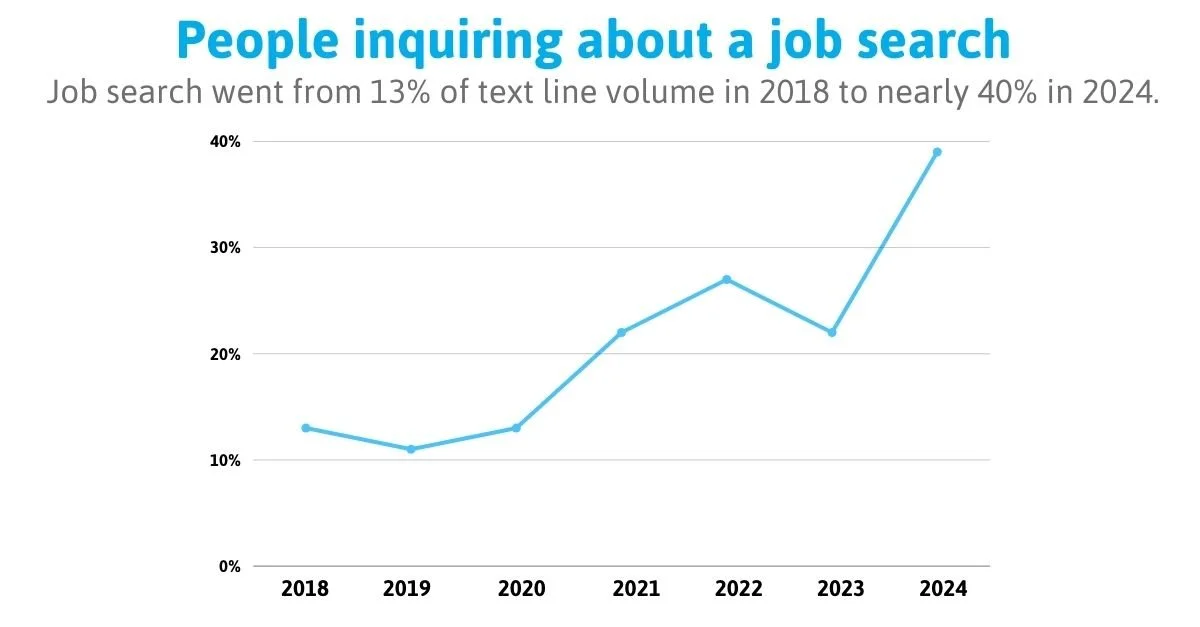
Empower Work began to see a sharp increase in job loss and job search as topics in text line conversations in early 2024. Job search and job loss went from 13% of text line volume in 2018 to over 40% in 2024. It has continued to grow over the course of 2024. In conversation after conversation, workers have expressed distress at how long their job search is taking, how they are not hearing from employers, and how it’s increasing their stress and anxiety. Or if they do secure a job, the working conditions expected fail to materialize.
Seeing the spike in distressed job seekers, Empower Work sought to understand what is happening for workers right now as they look for work. We wanted to explore insights not just in the moment when workers reached out on the text line for support, but more broadly for workers over time across industries, demographics, and geographies.
Our question: what does the job search feel like for people right now, especially for those more financially vulnerable who are earning less than $75,000/year?
Based on millions of text messages exchanged over the past five years, we know that workers have their own expression of their employment status. It’s not simply employed or unemployed. For this research, we used a scale of 1-5 for workers to select which description most aligned with their experience:
1= Unemployed, no UI benefits
2= Unemployed, receiving UI benefits
3= Underemployed
4= Employed, but looking for another job
5= Happily Employed
We then asked questions about their search for work, working conditions, and demographics to understand how their job search is impacting them.
This report highlights key findings from 913 survey responses across industries, demographics, and geographies as well as deeper stories that highlight the unique experiences of workers (see full demographics at end of report). It focuses specifically on people who make below $75,000/year. Those below this threshold make up more than half of all workers in the U.S.
The data paints a stark picture of what people are experiencing in the labor market right now:

Finding 1: Four out of five workers–over 78%–are actively looking for work because they are dissatisfied, underemployed, or unemployed.
Finding 2: Over 41% are unemployed.
Finding 3: Only 22% of workers are happily employed.
Finding 4: Underemployment is a source of strain for at least 10%, but many who are employed and looking for work are not getting full hours or pay expected.
Finding 5: Job searches are taking nearly half a year.*
Finding 6: Workers who are happily employed report twice the level of satisfaction in work-life balance, feeling valued, and growth opportunities compared to those who are employed but seeking new job opportunities.
Finding 7: Three of five unemployed workers experienced mental health changes during their job search due to emotional and financial strain.
* Not including those who are long-term unemployed (over a year).
Key Findings
Finding 1: Over 78% of workers are actively looking for work because they are dissatisfied, underemployed, or unemployed.
People are seeking employment that meets basic needs–pay that ensures they can take care of bills, fair working conditions, respect–and unable to find them.

For those currently employed, but looking for a new job, the top issues they are experiencing at work are: stress, toxic boss/workplace, disrespect, burnout, and difficult coworkers. The options did not include reduced hours or pay, but open responses indicate high financial concern due to changes in compensation.
For those unemployed, adverse work experiences in their prior employment were also factors. Nearly all unemployed workers said stress and/or anxiety (97%) impacted their employment. Additionally, 9 out of 10 unemployed workers experienced a toxic boss/workplace and disrespect in their previous job.

In their own words
“I am a 70 year old female and work with clients with developmental disabilities which I love. It is a rewarding job, but doesn’t meet my financial needs. Even with what I receive social security, I still live pay check to pay check.”
“I was explicitly told there were no opportunities for growth in my position, and my employer creates no path to grow at the organization. I am devalued at my job because I am expected to go above and beyond for no professional advancement. I am underpaid and undervalued. My employer is hostile to my union and I feel like I’ve been retaliated against because of that.”
Finding 2: Over 41% are unemployed.
While national unemployment data during the period of this study has a U-6 unemployment rate of 8.2%, when we ask workers directly, over 41% self described as unemployed. This personal description highlights a stark reality: there are many more who want to be employed than captured in current market calculations. This includes people who have recently left a job or lost a job to those who have been struggling with unemployment over a year.
Only 4.4% of respondents indicated that they are receiving unemployment benefits. The average length of search for those less than a year unemployed is within the range of weekly unemployment benefits in most states, but responses indicate that workers wish they had access. Open responses show those without unemployment have not qualified for reasons ranging from leaving a toxic work environment to changing states, being a gig worker to having health issues that prevent them from working.
Notably, those facing the highest unemployment include:

Age - 65% of respondents 65 years or older indicated unemployment, with significantly higher usage of unemployment benefits at 12%.
Racial/Ethnic Identity - Workers identifying as Native American or Alaska Native and Multiracial have the highest unemployment rates across all racial/ethnic identities.
Income - 68% of respondents making less than $15,000 in their prior employment identified as unemployed.
Industry - Those working in Agriculture, Construction, and Retail all had unemployment at or over 50%.
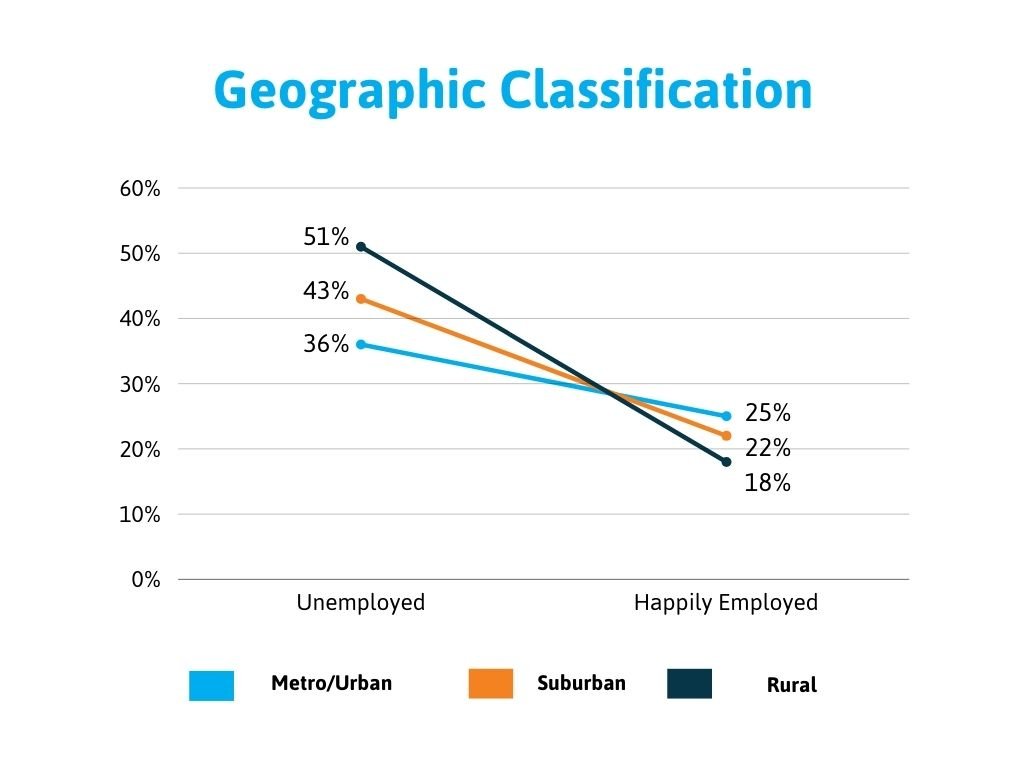
Geographic - More than half respondents in rural areas identified as unemployed.
Those with the lowest unemployment include:
Income - Workers earning between $76,000- $100,000 reported only 18% unemployment.
Industry - Those working in Government and Education have the lowest unemployment by industry, 24%.
Education - Those with a doctoral degree or an associate degree reported the lowest unemployment by education level at 20% and 23% respectively.
In their own words
“Unemployment rejected my claim so I’m left to try and do things on my own.”
“I was pushed out of one job into another. Then, the other job let me go right before my first back surgery. Since, I have been unable to work. I wasn’t able to qualify for Unemployment because of not being able to look for work. I don’t know what job I got injured on but it was one or both.”
“The toxic situation in my work environment caused mental anguish to the point that I couldn’t take it anymore and so I quit, thereby forgoing any possibility of unemployment benefits.”
Finding 3: Only 22% of workers are happily employed.
Securing employment is only part of the equation; workers are actively seeking positions that align with all their needs. Following tumultuous times marked by job losses and stress—from the COVID pandemic to the great reshuffle—current data reveals that a mere 22% of individuals earning under $75,000 are satisfied with their jobs.
With just 1 out of 5 workers self-identified as “Happily employed,” the following industries, education, and income levels stand out:
Lowest rates:
Job pay type - Only 5% of those paid under the table and 10% of gig workers are happily employed.
Income - Only 6% of workers making less than $15,000 are happily employed.
Racial/Ethnic Identity - Only 12% of multiracial workers reported being happily employed.
Education - Only 17% of workers with a bachelor’s degree report as being happily employed.
Highest rates:
Gender - 49% of workers who prefer not to say their gender and 40% of those who self-describe report as being happily employed. (Gender self-descriptions include: Agender, Trans, Non binary, Trans woman, Transmale, Androgynous trans man, gender fluid, Genderqueer/woman)
Job pay type - 36% of salaried employees are happily employed.
Industry - 45% of Legal, 35% of Government, and 33% of Education workers identify as happily employed.
To learn more about why workers identify as happily employed, see Finding 6, which outlines key drivers of workplace satisfaction.

In their own words
“I have been blessed to find an amazing career with a valued business. I am treated with respect, professionalism, paid survivable wages. I left such a horrific, degrading, overworked and underpaid, mentally and verbally abusive job.”
“I love where I work and I enjoy my coworkers and the people that I work with while giving 100% customer satisfaction.”
Finding 4: Underemployment is a source of strain for at least 10%, but many who are employed and looking for work are not getting full hours or pay expected.
Underemployment is typically defined as people who are working a job that does not fully utilize their skills, education, or availability to work. Underemployment masks the hidden pain of financial instability and personal dissatisfaction of being trapped in a role that does not fully leverage potential.
While only 10% of respondents self-identified as underemployed, frustrations of inadequate jobs for abilities or skills, inability to find full-time employment or secure full hours, and not finding jobs with pay that cover basic needs, surfaced highly among those employed and looking for work. It was also a component of many responses for the unemployed.
Notably:
Gender - Those who identify as a woman selected underemployed at higher rates. 70% of those who selected underemployed are women.
Income - A quarter of those reporting income between $16,000 - $25,000 identify as being underemployed.
Job pay type - Hourly workers represent over half of our respondents, at 51%.
Industries - The two highest industries are Service and Construction.

In their own words
“Not paid like I should be, underpaid and scarce working days.”
“Work is okay for now but I do not have a lot of hours which mean I do not make a lot and as a 23 turning 24 in two months so I need my pay to be a certain amount to live comfortably.”
“I was hired full time, however we are over staffed and I’m getting 16 hours a week. I have a two-year-old daughter I have to care for. It’s hard times right now. Currently looking for other employment.”
Finding 5: Job searches of active seekers are taking nearly half a year.*

On average job searches are taking 5.5 months. It’s higher for those unemployed without benefits at 6.7 months. The lowest among the job searches are the happily employed who were job searching while employed. Those with the lowest income–under $15,000–report the longest job search durations by income of 5.8 months.
In open responses and interviews, job seekers are experiencing significant frustration due to a challenging job market characterized by fewer openings and intense competition. Many workers feel hindered in blind application processes where acknowledgement and communication are lacking. Even those who do hear back and are invited to interview go through multiple interviews and meetings leading to prolonged job searches that often end in disappointment. Making matters worse are job scams and fake job postings that exacerbate feelings of self-doubt, a loss of confidence, and helplessness.
As a result, some job seekers are turning to alternative work options, including gig-work or self-employment out of necessity, while others face severe financial stress and uncertainty, struggling to secure positions that can sustain their livelihoods.
Notable data:
Age - Both the 40-49 and 50-64 age groups report generally longer job searches, both averaging roughly 6 months.
Racial/Ethnic Identity - Job searches are taking more than 6 months for those who identify as Asian at 7 months, Multiracial at 6.2 months, and those who self-describe at 8.6 months.
Geographic - Suburban workers exceed their urban and rural counterparts with job searches averaging 5.8 months.


In their own words
“I applied to hundreds of openings over 6 months. The job I accepted was the only one I heard back on & interviewed for. I accepted out of necessity and am still looking but again I have not any responses from employers.”
“It was way too long to search for a job that nobody was going to hire me for. I spent 2 years looking for a new job and now that I have decided to work for myself, it’s the best decision I’ve ever made.”
“It has been extremely difficult to find a job with such short notice that will pay enough to take care of my bills and family”
Finding 6: Workers who are happily employed report twice the level of satisfaction in work-life balance, feeling valued, and growth opportunities compared to those who are employed but seeking new job opportunities.

Happily employed workers are significantly more satisfied in all five essentials for workplace mental health and well-being as defined by The Surgeon General’s Framework for Workplace Mental Health and Well‑Being. They include feeling protection from harm, connection and community, work-life harmony, mattering at work, and opportunity for growth. By contrast, unemployed, underemployed, and those who are employed but looking show significantly lower levels of satisfaction across all five categories.
Most notably is that in three of the five categories, twice as many happily employed workers are satisfied with work-life harmony, feeling valued, and opportunities for growth.
Work-Life Harmony = 80% satisfied when happy at work but falls to 38% when employed but looking for a new job.
Feeling Valued = 80% happily employed are satisfied and drops to just 29% satisfaction for workers who are employed but looking.
Opportunities for Growth drops from 63% satisfaction for happily employed workers to 31% satisfaction for workers who are employed but looking for another job.

In their own words
“I have been blessed to find an amazing career with a valued business. I am treated with respect, professionalism, and paid survivable wages. I left such a horrific, degrading, overworked and underpaid, mentally and verbally abusive job.”
“I work at [company], we are all treated really well and everyone is super friendly.”
Finding 7: Three of five unemployed workers experienced mental health changes during their job search due to emotional and financial strain.

Workers reflect on the compounding weight of anxiety and depression that stems from financial and emotional struggles associated with finding a job. Job seekers struggle with self-doubt, repeated disappointment, loss of confidence, isolation and despair each time a hopeful application doesn’t result in a job offer. Financial hardship associated with unemployment exacerbates these mental health challenges, as individuals face difficulties in affording essential needs like food, shelter and healthcare.
The stress of prolonged unemployment or underemployment can exacerbate mental health issues, such as anxiety and depression, making it even more challenging to maintain the motivation and resilience needed to continue their job search. This creates a difficult cycle where financial strain and mental health challenges feed into each other, complicating the path to finding suitable and fulfilling employment.
Key takeaways:
Overall, 2 out of 5 unemployed job seekers feel depressed.
Two of every three unemployed respondents mentioned financial impact.
74% of job seekers who express financial impact also identified mental health impact.
Half of unemployed respondents experience a decrease in self confidence or esteem.
Gender - Those who self describe indicate experiencing depression twice as much as men or women, at 89%.
Self-described genders written in by respondents include: Agender, Trans, Non binary, Trans woman, Transmale, Androgynous trans man, gender fluid, Genderqueer/woman
Age - 55% of 40-49 year old job seekers indicate they experience depression, 15% higher than other age groups.
Racial/Ethnic Identity - More than half (53%) of Hispanic/Latino job seekers feel depressed.
Income - Half of workers making $36K-50K feel depressed. Interestingly, 63% of workers making $76-100K feel depressed.
Industry - 56% of job seekers in Government and half from healthcare and financial services job seekers feel depressed.

In their own words
“Right now, I’m in need of assistance as I’ve been out of work since the day before Halloween 2023. I’ve been on 5 interviews (ghosted three times, rejected twice). Currently at risk of homelessness.”
“Applying everywhere but not a single call back so I’m struggling to stay afloat in my daily activities.”
“Getting rejected over and over again is hard.”
The Impact on Workers
As people strive to land a job that covers their needs and the time for a search ticks up, workers are left feeling isolated, destabilized, and disheartened.
Five deeper stories highlight the complexities of the strain:

Daisy
Job Status: Unemployed, no benefits
Industry: Financial Services
Area: Rural
Salary: Less than $15,000
“I’ve been unemployed for a year and seven months, and it’s been really hard. I’ve been trying to apply to jobs through websites that feel legit, like LinkedIn or Indeed, but I’ve noticed that I’ve been getting a lot of fake interviews and job advertisements. At these fake interviews, they started asking me weird questions like, “Where can we send you your paychecks?” Then they were asking me for my pay stub and to submit a check through my bank. That’s how I knew it was a scam.
I feel like I could get a job, I just need to overcome my shyness, because I’m good at what I do. I don’t talk a lot because I get nervous, which has been a barrier. The job search is impacting my day-to-day life. Not having the funds available has been struggling—I’m struggling just to make payments, even just paying for gas.”

Shawn
Job Status: Underemployed
Industry: Healthcare & Social Services
Area: Metro/Urban
Salary: Less than $15,000
“My current job now is a resume coach at a nonprofit organization. My responsibilities are to help first-generation college students or external partners on their resumes. It’s been really fulfilling, but it sucks because the pay is based on how many students they accept into the fellowship. So depending on the season, you may be lucky to get five or six students. I wish there was a bigger caseload so I could make a steady income.
The main reason it’s impacting me is the fact that I’m also a student and in the climate we’re living in right now, rent is high and expenses are through the roof. The job market itself is also extremely challenging. I’ve been looking for full-time work outside of this job—I’m constantly applying to at least 50-100 jobs and not hearing anything back.”

Trell
Job Status: Underemployed
Industry: Groundskeeper/Maintenance
Area: Metro/Urban
Salary: $16,000-$25,000
“I was underemployed at my job—I was hired at a bad time. One company originally owned it and went bankrupt, and another company bought it. It was chaotic and that’s why I no longer work there. I don’t like working somewhere where there’s a lack of communication with the HR department. I had been hired as a full-time employee and was guaranteed 40 hours, but only got scheduled to work 20-30 hours a week—that’s ridiculous!
The job search has been tough since I left, I just don’t give up and keep pushing. There’s not a lot of options out there. I also face challenges, having a criminal record. I don’t have a violent offense and it was more than seven years ago, but some employers don’t give me a chance even though their postings say that people with criminal backgrounds are encouraged to apply. It’s happened where I'll get the job and be onboarding, and then once the background check comes back, they'll rescind the offer.”
*Between taking the survey and interviewing with us, Trell left his job and is now unemployed.

Kyla
Job Status: Employed, but looking for another job
Industry: Healthcare & Social Services
Area: Suburban
Salary: $16,000-$25,000
“I’m currently working as a part-time home health aide. I’m currently looking for a second job, whether it's part-time or full-time, but it's a little bit hard due to the area where I live. I currently don't have my [drivers] license so it's a little bit harder to commute to certain places. It's difficult, trying to find work or find a job that's willing to pay a reasonable amount. The part-time job I have right now is currently only 13 hours, so it's a little difficult trying to budget on a weekly paycheck with bills and expenses.
I'm not guaranteed to always have a client due to the work that I do. I work with the elderly so sometimes they go into hospice care and are sent to the hospital or pass away, so sometimes during those situations I don't have work at that time. This impacts me because it’s pretty difficult money-wise. I'm penny-pinching and trying to save all the money that I can save from my last job because I usually try to save money just in case emergencies come up. I feel like there are a lot of people that are having a very difficult time finding work and I don't think it gets talked about enough which is very upsetting to me because it took me a year and a half to find the job that I have and it was a very emotional time.”
Bridgett
Job Status: Underemployed
Industry: Retail
Area: Metro/Urban
Salary: Less than $16,000 - $25,000
“I worked with a food delivery company for several months. The time, the effort, and the gas money makes it difficult—by the time you pay for insurance and other expenses, you don’t really come out ahead. It does help on a day-to-day basis, but living paycheck to paycheck is hard. It’s a big struggle, especially being a single mom. Having a college education, but also having a criminal record—it does me no good. Employers see that I have good communication skills, that I’m bilingual, but see my name and situation on paper and don’t even give me a chance. It’s over for me.
I’m on Section 8 and I get food stamps, it’s hard. My son and I were homeless for a whole year. There were days where we’d have to sleep at a park because we had nowhere to go or we’d go to someone’s house. My son has special needs and gets hyper and makes noises so some people can’t handle that. Now that I’m somewhat back on my feet, getting a job is challenging because of the difficulty of finding childcare. I don’t just have job search fatigue, I have everything fatigue.”
Closing
Overall, the impact the job search is having on workers is stark. In particular, there seems to be a perfect storm of long search length and a lack of jobs that meet needs, leading to significant despair and negative financial impact.
While we see the toll of stress on Empower Work’s text line, the larger data set including both those who have used Empower Work’s text line and workers who have not, shows the challenges presented on the text line are not unique.
Nearly four out of five people struggling to find a job that works for them highlights a glaring gap in the market that needs wider attention and action.
Lifting the experiences and voices of people struggling to find work that meets their basic needs, we hope adds insights for a range of programs such job training, placement, hiring, and support initiatives, government services, and most importantly, helps workers feel like they are not alone.
Demographics of Survey Respondents
Race/Ethnicity

Geography

Age

Income

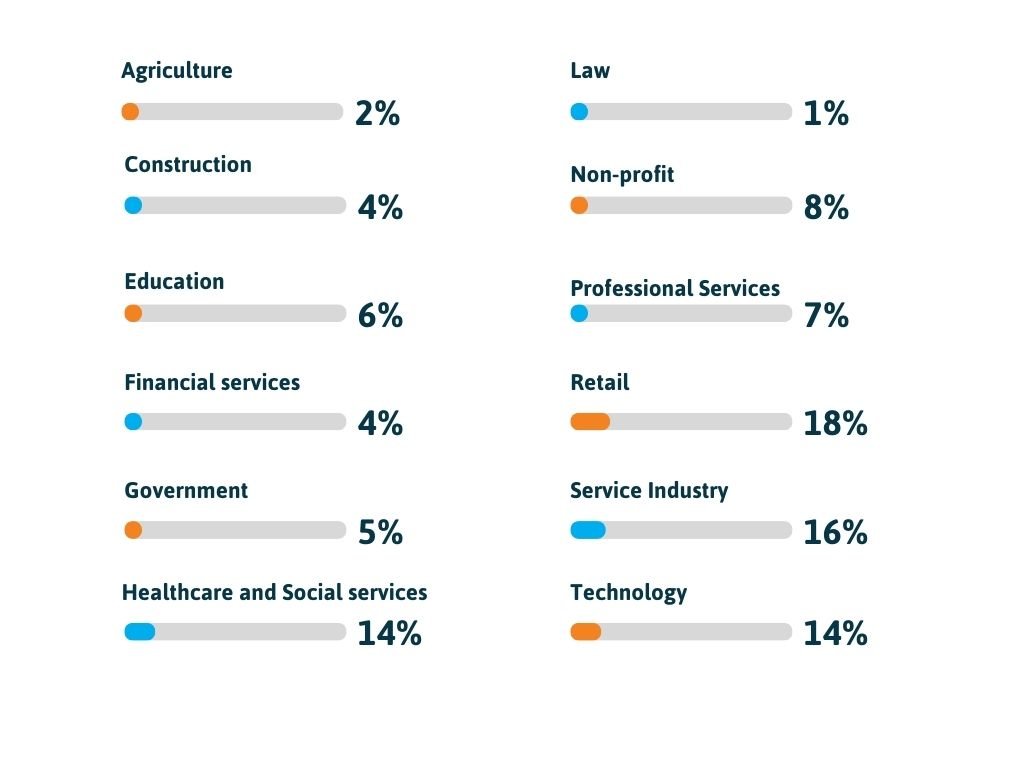
Industry
Gender

Education

Sexuality

Job Type

Methodology
Sampling
We analyzed 7,300 text message conversations from January 2023 to July 2024 to determine questions we were curious to learn more about from a sampling of workers across the United States. We collected surveys from 913 individuals between July and August 2024. Survey recipients included Empower Work help seekers along with workers from a wide range of partners including Visible, WorkMoney, New Door Ventures, CodePath, Community Legal Services (CLS), NPower, YUPRO, Techtonica, and online communities.
Our sample of 913 U.S. workers provides a comprehensive overview of the current workforce, aligning closely with national census data in many key areas, while also highlighting some interesting variances.
Gender: Our sample includes a higher proportion of women (60%) compared to the census data, which shows a more balanced gender distribution.
Age: We have a younger demographic, with a significant representation in the 30-39 age group (37%), compared to national averages.
Racial/Ethnic origin: There is a notably higher percentage of Black respondents (27%) and a lower percentage of White respondents (38%) in our sample than seen in census data.
Sexual Orientation: Our sample reflects a higher representation of LGBTQ+ individuals (30%), indicating a diverse range of sexual orientations.
Income: The sample shows a higher concentration of respondents in the lower income bracket (28% earning less than $15,000).
Job Pay Type: We observe a higher percentage of gig workers (11%) compared to national averages (5%).
Industry: The distribution across industries is fairly aligned, though there is a slightly higher representation in Retail.
Geographic Location: Our sample includes a larger rural population (26%) than typically observed in census data, providing insights into rural workforce dynamics.
Education Level: There is a higher percentage of respondents with some college education (26%), but fewer with bachelor's and master's degrees.
While our sample aligns with national data in many respects, these variances offer valuable insights into specific demographic and economic workforce trends.
Data Analysis
Data was collected using an online survey that was sent via text or email to U.S. workers. The survey gathered broad, numerical insights into specific topics relevant to the workforce. Responses were reviewed and any anomalies were identified, reviewed, and either corrected or removed. The data was aggregated to summarize key metrics such as averages, frequencies, and distribution to identify patterns and trends within the dataset. Qualitative data was collected through open responses and through 30-minute, one-to-one interviews conducted via Zoom.
Participants represented a diverse range of demographics, providing rich, detailed insights into their personal experiences and perspectives to lend a human voice to the data.
About Empower Work
Empower Work is a national nonprofit that envisions a world where everyone can thrive at work. We’re on a mission to create healthy, equitable workplaces where people are valued, supported, and empowered in ways that support their economic mobility, emotional well-being, and career success. Through our free, confidential text line, we improve the wellbeing of historically marginalized workers through coaching and resources that support increased confidence, clarity, agency, empowerment, and economic security – all rooted in equity.
Acknowledgements
This research report would not have been possible without the generous support of Visible by Verizon. Their sponsorship has been instrumental in advancing our independent research.
This research was inspired by growing job loss and job search demand. We are grateful to Visible for their partnership on Connection Protection, a program that supports people who are experiencing a job loss, had their hours cut, or are between jobs with resources and support to stay connected to employment.
We deeply appreciate the support provided by Milltown Partners, whose pro-bono services and effective communication have greatly contributed to the success of this report.
A special thank you to the numerous organizations that graciously shared the worker survey with their communities including Community Legal Services (CLS), CodePath, Colorstack, New Door Ventures, NPower, Per Scholas, Techtonica, WorkMoney, and YUPRO. Your collaboration has made a deep impact on our research and has helped us elevate workers’ voices and perspectives.
And most importantly, thank you to every person who generously shared their experiences with us. Your voices are a crucial reflection of the struggles people are facing right now.
Report made possible with generous support from:

For media inquiries, please contact our team at: press@empowerwork.org.